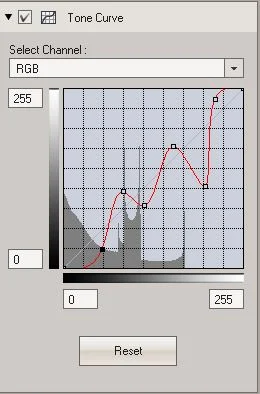
The Tone Curve tool, as available in most image editors, as well as on Olympus Viewer 3 (OV3), is a graphical representation of the tonal range of your image and it allows you to manipulate the brightness and contrast of the red/green/blue (RGB) color gamut or the individual red, green and blue channels by picking the color separately from the drop-down list.
At its default value, the tone curve is represented as a straight, diagonal line within the gray histogram window which displays the distribution of the color in terms of tones and contrast.
The tone curve can be changed by placing the cursor on the red line and dragging it up or down from the red line. The lower left of the line is the shadow end and the upper right is the highlight end. The middle of the line represents the mid-tones.
The line can be dragged at multiple points along the line for varying results. The curve can be controlled using a number of anchor points placed along the line. In OV3 the result of a given curve is immediately displayed in the Image Window.
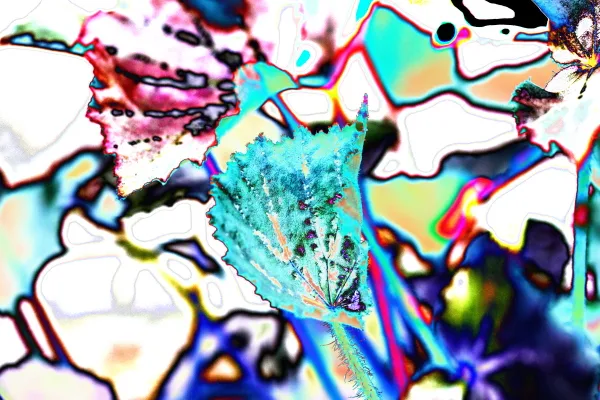
Time to challenge yourself. Go beyond what is shown in the Tone Curve tool image as shown here and you are in for a wild ride. All images above are done on the trot, with no presets, and no visuals of what the image will turn out to be. Have fun.


No comments:
New comments are not allowed.